By the end of this lesson, students will be able to:
Understand and apply the Split-Apply-Combine strategy to analyze grouped data.
Use groupby() to split a pandas.DataFrame by one or more columns.
Calculate summary statistics for groups in a pandas.DataFrame.
Use method chaining for readable data analysis.
Explain how groupby() handles NA values and choose between count() and size() to count observations in each group.
About the data
For this lesson we will use the Palmer Penguins dataset [2] developed by Drs. Allison Horst, Alison Hill and Kristen Gorman. This dataset contains size measurements for three penguin species in the Palmer Archipelago, Antarctica during 2007, 2008, and 2009.
The Palmer Archipelago penguins. Artwork by Dr. Allison Horst.
The dataset has 344 rows and 8 columns. Let’s start by loading the data:
import numpy as npimport pandas as pd# Load Palmer penguins dataURL ='https://raw.githubusercontent.com/allisonhorst/palmerpenguins/main/inst/extdata/penguins.csv'penguins = pd.read_csv(URL)penguins.head()
species
island
bill_length_mm
bill_depth_mm
flipper_length_mm
body_mass_g
sex
year
0
Adelie
Torgersen
39.1
18.7
181.0
3750.0
male
2007
1
Adelie
Torgersen
39.5
17.4
186.0
3800.0
female
2007
2
Adelie
Torgersen
40.3
18.0
195.0
3250.0
female
2007
3
Adelie
Torgersen
NaN
NaN
NaN
NaN
NaN
2007
4
Adelie
Torgersen
36.7
19.3
193.0
3450.0
female
2007
Summary statistics
It is easy to get summary statistics for each column in a pandas.DataFrame by using methods such as:
sum(): sum values in each column,
count(): count non-NA values in each column,
size(): count the number of values in a column (including NA values),
min() and max(): get the minimum and maximum value in each column,
mean() and median(): get the mean and median value in each column,
std() and var(): get the standard deviation and variance in each column.
Example
# Get the number of non-NA values in each column
penguins.count()
species              344
island               344
bill_length_mm       342
bill_depth_mm        342
flipper_length_mm    342
body_mass_g          342
sex                  333
year                 344
dtype: int64
# Get minimum value in each column with numerical valuespenguins.select_dtypes('number').min()
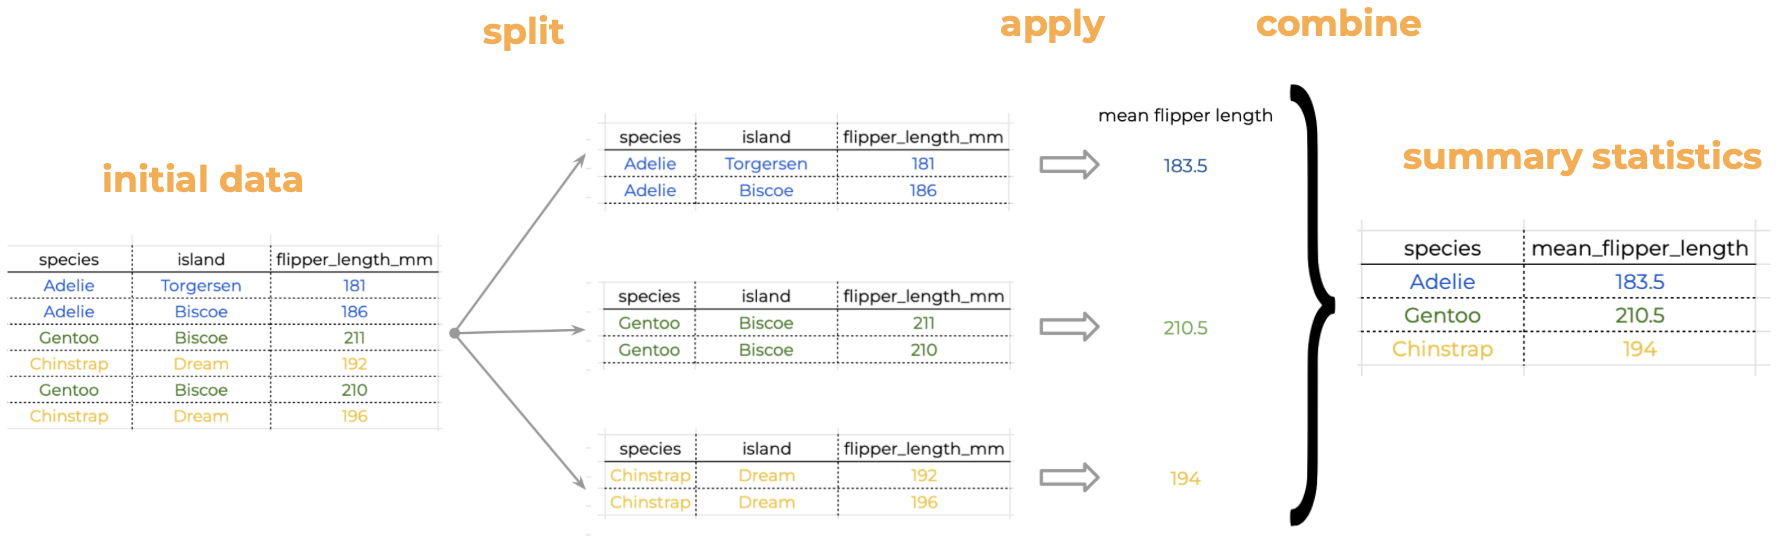
Our penguins data is naturally split into different groups: there are three different species, two sexes (with some missing values), and three islands. Often, we want to calculate a certain statistic for each group. For example, suppose we want to calculate the average flipper length per species. How would we do this “by hand”?
We start with our data and notice there are multiple species in the species column.
We split our original table to group all observations from the same species together.
We calculate the average flipper length for each of the groups we formed.
Then we combine the values for average flipper length per species into a single table.
This is known as the Split-Apply-Combine strategy. This strategy follows the three steps we explained above:
Split: Split the data into logical groups (e.g. species, sex, island, etc.)
Apply: Calculate some summary statistic on each group (e.g. average flipper length by species, number of individuals per island, body mass by sex, etc.)
Combine: Combine the statistic calculated on each group back together.
Split-apply-combine to calculate mean flipper length
For a pandas.DataFrame or pandas.Series, we can use the groupby() method to split (i.e. group) the data into different categories.
The general syntax for groupby() is
df.groupby(columns_to_group_by).summary_method()
Most often, columns_to_group_by is a single column name (a string) or a list of column names. The unique values of the column (or columns) will be used as the groups of the data frame.
Example
If we don’t use groupby() and directly apply the mean() method to our flipper length column, we obtain the average of all the values in the column:
penguins['flipper_length_mm'].mean()
200.91520467836258
To get the mean flipper length by species we first group our dataset by the species column’s values. However, if we just use the groupby() method without specifying what we wish to calculate on each group, not much happens up front:
penguins.groupby('species')['flipper_length_mm']
<pandas.core.groupby.generic.SeriesGroupBy object at 0x107e17950>
We get a GroupBy object, which is an intermediate step. It doesn’t perform the actual calculations until we specify an operation:
# Average flipper length per speciespenguins.groupby('species')['flipper_length_mm'].mean()
Let’s recap what happened in that line (the . can be read as “and then…”):
start with the penguins data frame, and then…
use groupby() to group the data frame by species values, and then…
select the 'flipper_length_mm' column, and then…
calculate the mean() of this column with respect to the groups.
Notice that the name of the series is the same as the column on which we calculated the summary statistic. We can easily update this using the rename() method:
# Average flipper length per speciesavg_flipper = (penguins.groupby('species') ['flipper_length_mm'] .mean() .rename('mean_flipper_length') .sort_values(ascending=False) )avg_flipper
Suppose we want to know the mean flipper length, this time by examining separately penguin species surveyed on each island.
# Average flipper length per species and islandavg_flipper_species_island = (penguins.groupby(['species','island']) ['flipper_length_mm'] .mean() .rename('mean_flipper_length') .sort_values(ascending=False) )avg_flipper_species_island
species    island
Gentoo     Biscoe       217.186992
Chinstrap  Dream        195.823529
Adelie     Torgersen    191.196078
           Dream        189.732143
           Biscoe       188.795455
Name: mean_flipper_length, dtype: float64
Grouping and NA values
Notice first that 11 penguins have no recorded sex. We can check this using:
size: returns the number of observations in a pandas.Series
count(): returns the number of non-NA observations in the series
# Number of NA observationspenguins['sex'].size - penguins['sex'].count()
11
By default, groupby() leaves out the rows where the grouping column has NA values. When we group by sex and count the number of observations (rows) we are left with, the 11 NA values are not included:
penguins.groupby('sex').size()
sex
female    165
male      168
dtype: int64
To keep the NA values as their own group, we use the dropna=False parameter:
penguins.groupby('sex', dropna=False).size()
sex
female    165
male      168
NaN        11
dtype: int64
Check-ins
Check-in
We are interested in knowing the number of penguins surveyed on each island in different years.
Run
penguins.groupby(['island','year']).count()
and
penguins.groupby(['island','year']).size()
Discuss the differences between each output. What method would give you the number of penguins surveyed on each island and year combination?
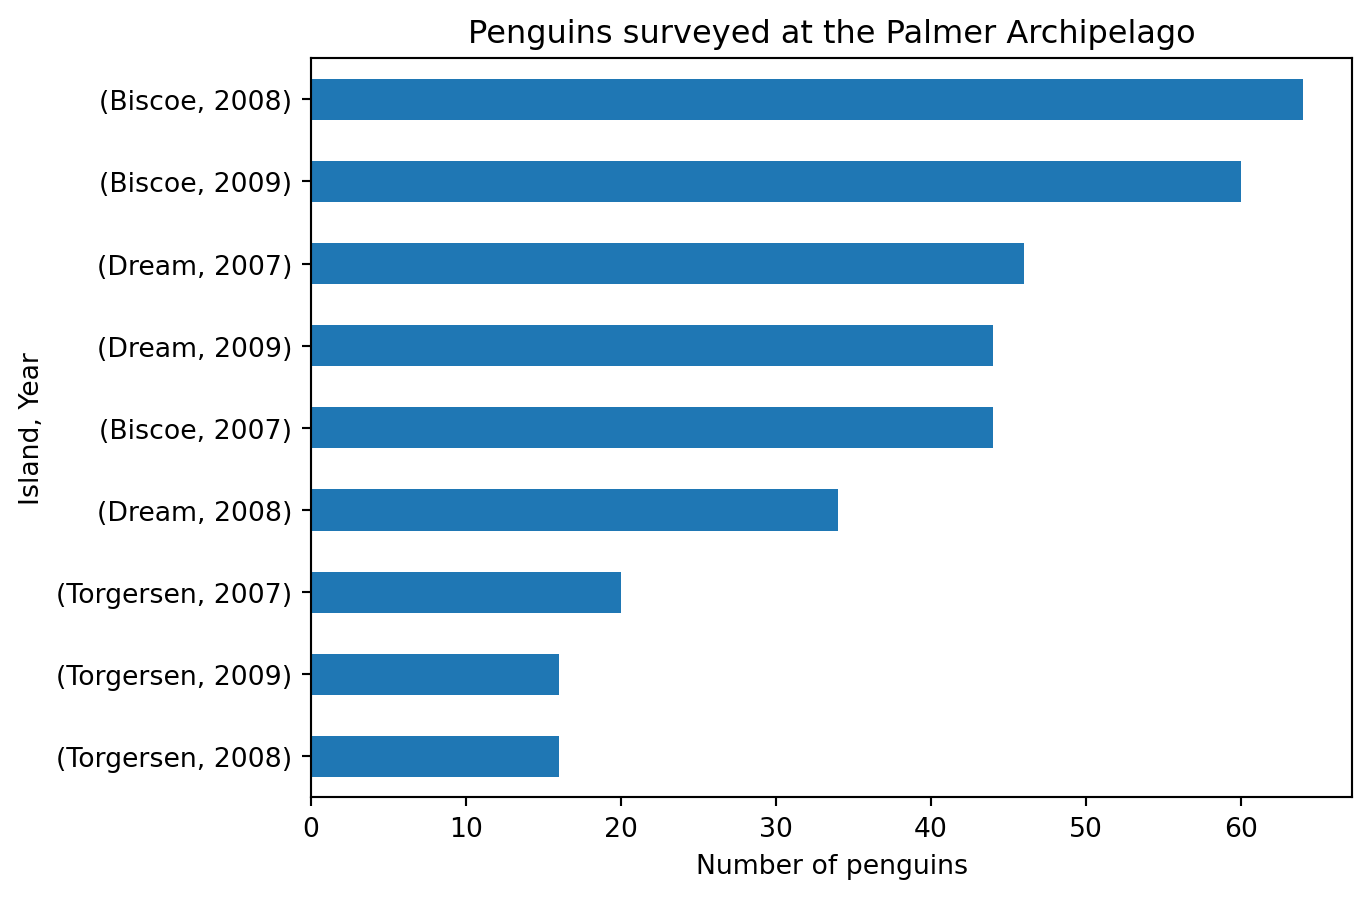
Let’s say we want to plot the surveyed population per year and island. We could then use method chaining to do this:
(penguins.groupby(['island','year'])
         .size()
         .sort_values()
         .plot(kind='barh',
                title='Penguins surveyed at the Palmer Archipelago',
                xlabel='Number of penguins',
                ylabel='Island, Year')
         )
Check-in
Use the max() method to calculate the maximum value of a penguin’s body mass by year and species.
Use (1) to display the highest body masses per year and species as a bar plot in descending order.
References
[1]
H. Do-Linh, C. Galaz García, M. B. Jones, and C. Vargas Poulsen, Open ScienceSynthesis training Week 1. NCEASLearningHub & DeltaStewardshipCouncil. 2023. Available: https://learning.nceas.ucsb.edu/2023-06-delta/