Assignment 2
This assignment covers topics in the notes up to the time series lesson. Task 1 will contribute 20% to the total grade of the assignment and tasks 2 and 3 will contribute 40% each.
Submission instructions
For your upcoming assignment submission, you’ll be downloading your notebooks and then uploading them to Gradescope. Before you upload your finished notebooks to Gradescope, please rename your notebooks so they are called
hwk2-task2-salmon-YOURLASTNAME.ipynbandhwk2-task3-aqi-YOURLASTNAME.ipynb.
It’s important to do this so we can keep track of resubmissions.
Thanks!
Otter Grader Checks
These notebooks utilize the otter library and have self contained checks within the notebooks to ensure you are on the right track. Follow the steps below to run the otter grader checks.
- Run the very first cell of the notebook that contains
#Initialize Otter. - Fill in code where the notebook instructs you to do so.
- When you encounter a
gracer.check()cell, like the image below, run the cell. Doing so will either return an emoji with the text “q# passed!”, or it will tell you the test did not pass. If your test did not pass, try rereading the prompt and making sure your output is what you would expect. If you can’t figure out where the issue is, discuss it with other people (first option always!), use Slack, or come see Annie or Carmen during student hours.
- The very last cell of the notebook contains a cell with
grader_check_all(). This runs all tests in the notebook and reports the tests that have passed as well as the ones that have failed. If the output of this cell looks like the image below (question numbers may differ), it means you passed all the autograder checks!
AI Policy
Task 1: Better Science in Less Time Using Open Data Science Tools reading
Using the right tools for a reproducible, efficient, and shareable workflow can be transformational. The article Our Path to Better Science in Less Time Using Open Data Science Tools [1] recounts how switching to open data science tools made it possible to transform the Ocean Health Index into an updatable and adaptable project. Although the paper focuses on using R, their learnings go well beyond this programming language and apply to anyone seeking to improve the reproducibility of their data analyses.
Want to hear more about paths to open science with accompanyed by beautiful ilustrations? Check out this talk where Dr. Allison Horst and lead author Dr. Julie Lowndes share their personal journey’s towards open science and introduce the Openscapes program!
Read the paper and write a one-paragraph (between 100 and 150 words) reflection about it. Review the rubric for this assignment here. Answer at least one of the following questions for your reflection:
- In your previous working experience, have you been working with reproducibility in mind? Which tools have allowed you or prevented you from making your work reproducible?
- The paper presents different strategies for learning intentionally. Have you used any of these strategies? Could you adopt some as you progress in your courses and career?
- What do the authors see as the role of Git and GitHub in supporting reproducibility, transparency, and communication? Is your experience using these tools similar?
Setup for tasks 2 and 3
Task 2: Wrangling Alaska salmon catch data
This exercise is based on the Cleaning and Wrangling Data in R lesson by the NCEAS Learning Hub [2].
In this task you will use simplified data from the Alaska Department of Fish & Game containing commercial salmon catch data from 1878 to 1997 [3]. The original data can be accessed from the KNB repository.
Follow the instructions in the notebook hwk2-task2-salmon.ipynb to complete this task. Review the rubric for this assignment here. In this task you will practice:
- detecting and wranglig messy data
- updating column data types
- obtaining summary statistics by groups
- creating exploratory plots
- creating a continuous, polished workflow
- version control with git following best practices
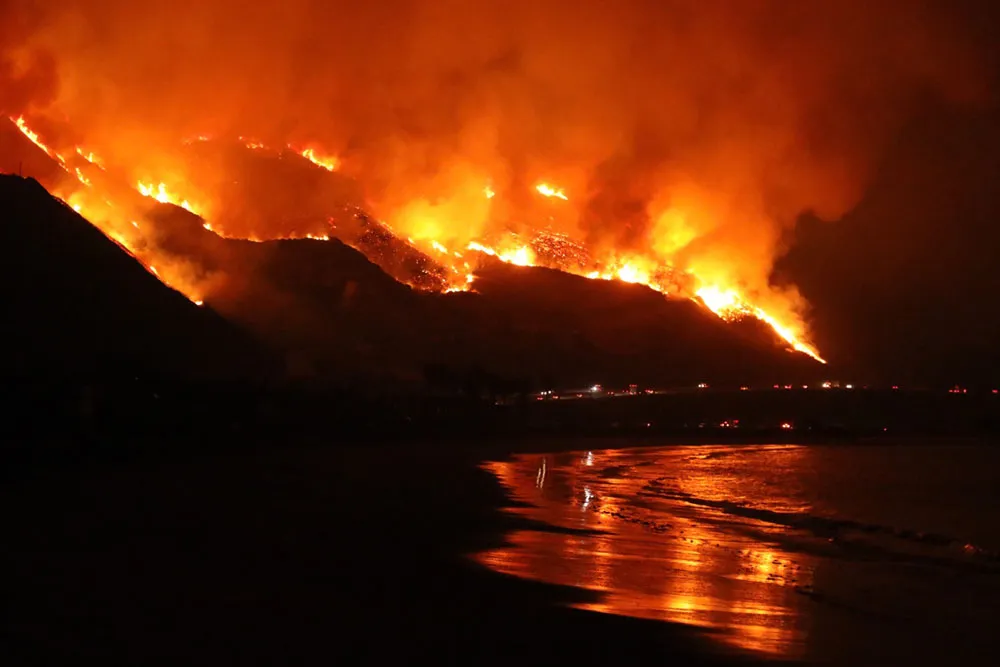
Task 3: Visualizing AQI during the 2017 Thomas Fire in Santa Barbara County
In this task you will use Air Quality Index (AQI) data from the US Environmental Protection Agency to visualize the impact on the AQI of the 2017 Thomas Fire. The Thomas Fire, which burned across Santa Barbara and Ventura counties in December 2017, has been one of California’s largest wildfires, devastating over 280,000 acres of land, destroying wildlife habitats, and leading to soil erosion and increased flood risks in the region.
Follow the instructions in the notebook hwk2-task3-aqi.ipynb to complete this task. Review the rubric for this assignment here. In this task you will practice:
- date and string data wrangling
- combining multiple data frames
- visualizing time series
- creating a continuous, polished workflow
- version control with git following best practices