Arctic regions geospatial wrangling
Week 6 - Discussion section
In this discussion section you will wrangle geospatial data about Arctic communities.
Setup
General directions
About the data
Arctic communities hold immense value in traditional knowledge and environmental stewardship, offering unique insights into sustainable practices and ecosystem management in one of the planet’s most extreme environments. For this section you will use a dataset derived from the list of Arctic communities and their location [1] created by the Alaska Native Tribal Health Consortium and Natural Earth’s medium-scale cultural boundaries data for countries (1:50m) following the procedure in the Reprojecting notes.

The data is in the arctic_communities.geojson file located in the the shared data Google folder for the EDS 220 class. Each geospatial feature in the data represents an Arctic territory with the following attributes:
| Attribute | Description |
|---|---|
| admin | name of the territory |
| country | two-letter code |
| n_communities | number of Arctic communities in the territory |
1. Data loading and exploration
Download the data
arctic_communities.geojsonfrom Google drive and add it to yourdata/directory as appropriate.Read in the data into a variable named
dfand examine it with your team.
2. Brainstorm
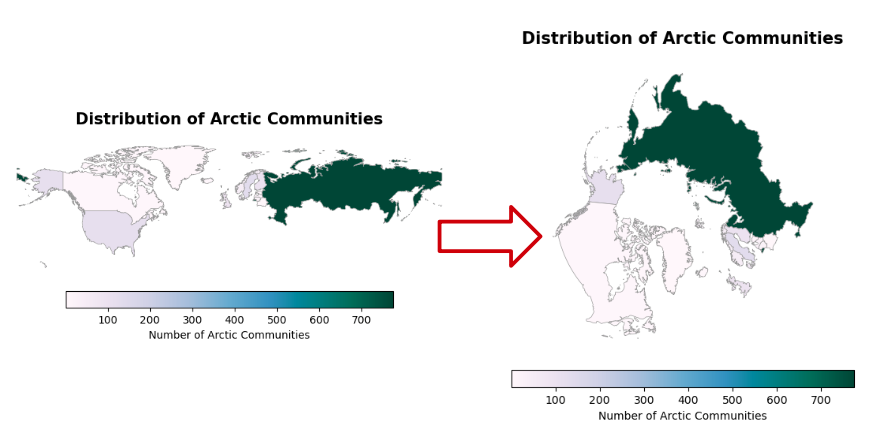
The goal of these exercises is to refine the Arctic communities choropleth map created in the Reprojecting lesson to restrict the plotting to the Arctic relevant regions:

Individually, write down high-level steps on how you would explore and wrangle the data to produce the updated map. Do not code anything yet.
Discuss your high-level steps with your team. What do you see as potential challenges to implementing your plan?
The next exercises will guide you through selecting relevant Arctic regions. There are many ways of doing this. The one presented here might not be the same way you thought about doing it - that’s ok! This one was designed to practice creating functions.
2. Check geometry types
Run
df.geom_type. Write a brief explanation about the output in a markdown cell.Create an
if-elsestatement that:prints “Multiple feature types:” followed by the unique geometry types (no repetition) in the geodataframe if not all the features are polygons, and
prints “All features are:” followed by the unique geometry type if all the features in the geodataframe have the same geometry type.
Wrap up your code into a function named
check_polygonsthat receives a single geodataframe as its parameter and prints out a message about the geometry types in the geodataframe.
3. Explode polygons
Overwrite the
dfgeodataframe with the output from theexplodemethod with theindex_partsparameter set toFalse. Read the documentation for the method and use a markdown cell to write a brief explanation of what is being done.Reset the index of
df.Use your
check_polygonsfunction to verify thatdfonly has features of type polygon.
Don’t forget to write informative commits in the imperative every time you finish a major step.
4. Compute minimum y-coordinate for polygons
At this point, every row in your df should be a single polygon.
Select the first row of
dfusingiloc. What kind of Python object is this?Select the geometry of the first row of
df. What kind of Python object is this?Use the
boundsattribute forshapely Polygonsto select the southern-most bound of the first polygon indf.Create a function
min_ythat receives a single row of a geodataframe as its parameter and returns the minimum y-coordinate of its bounding box.Use the
min_yfunction and theapplymethod for data frames to create a new columnminyindfwhich has the minimumycoordinate.
5. Filter, update CRS, and reproduce map
Select the polygons with a bounding box at or above 40 degrees of latitude into a new variable named
arctic.Reproduce the Arctic communities map by updating the CRS to EPSG:3413.