Creating a GIF of water level change at Lake Cachuma
Week 10 - Discussion section
About
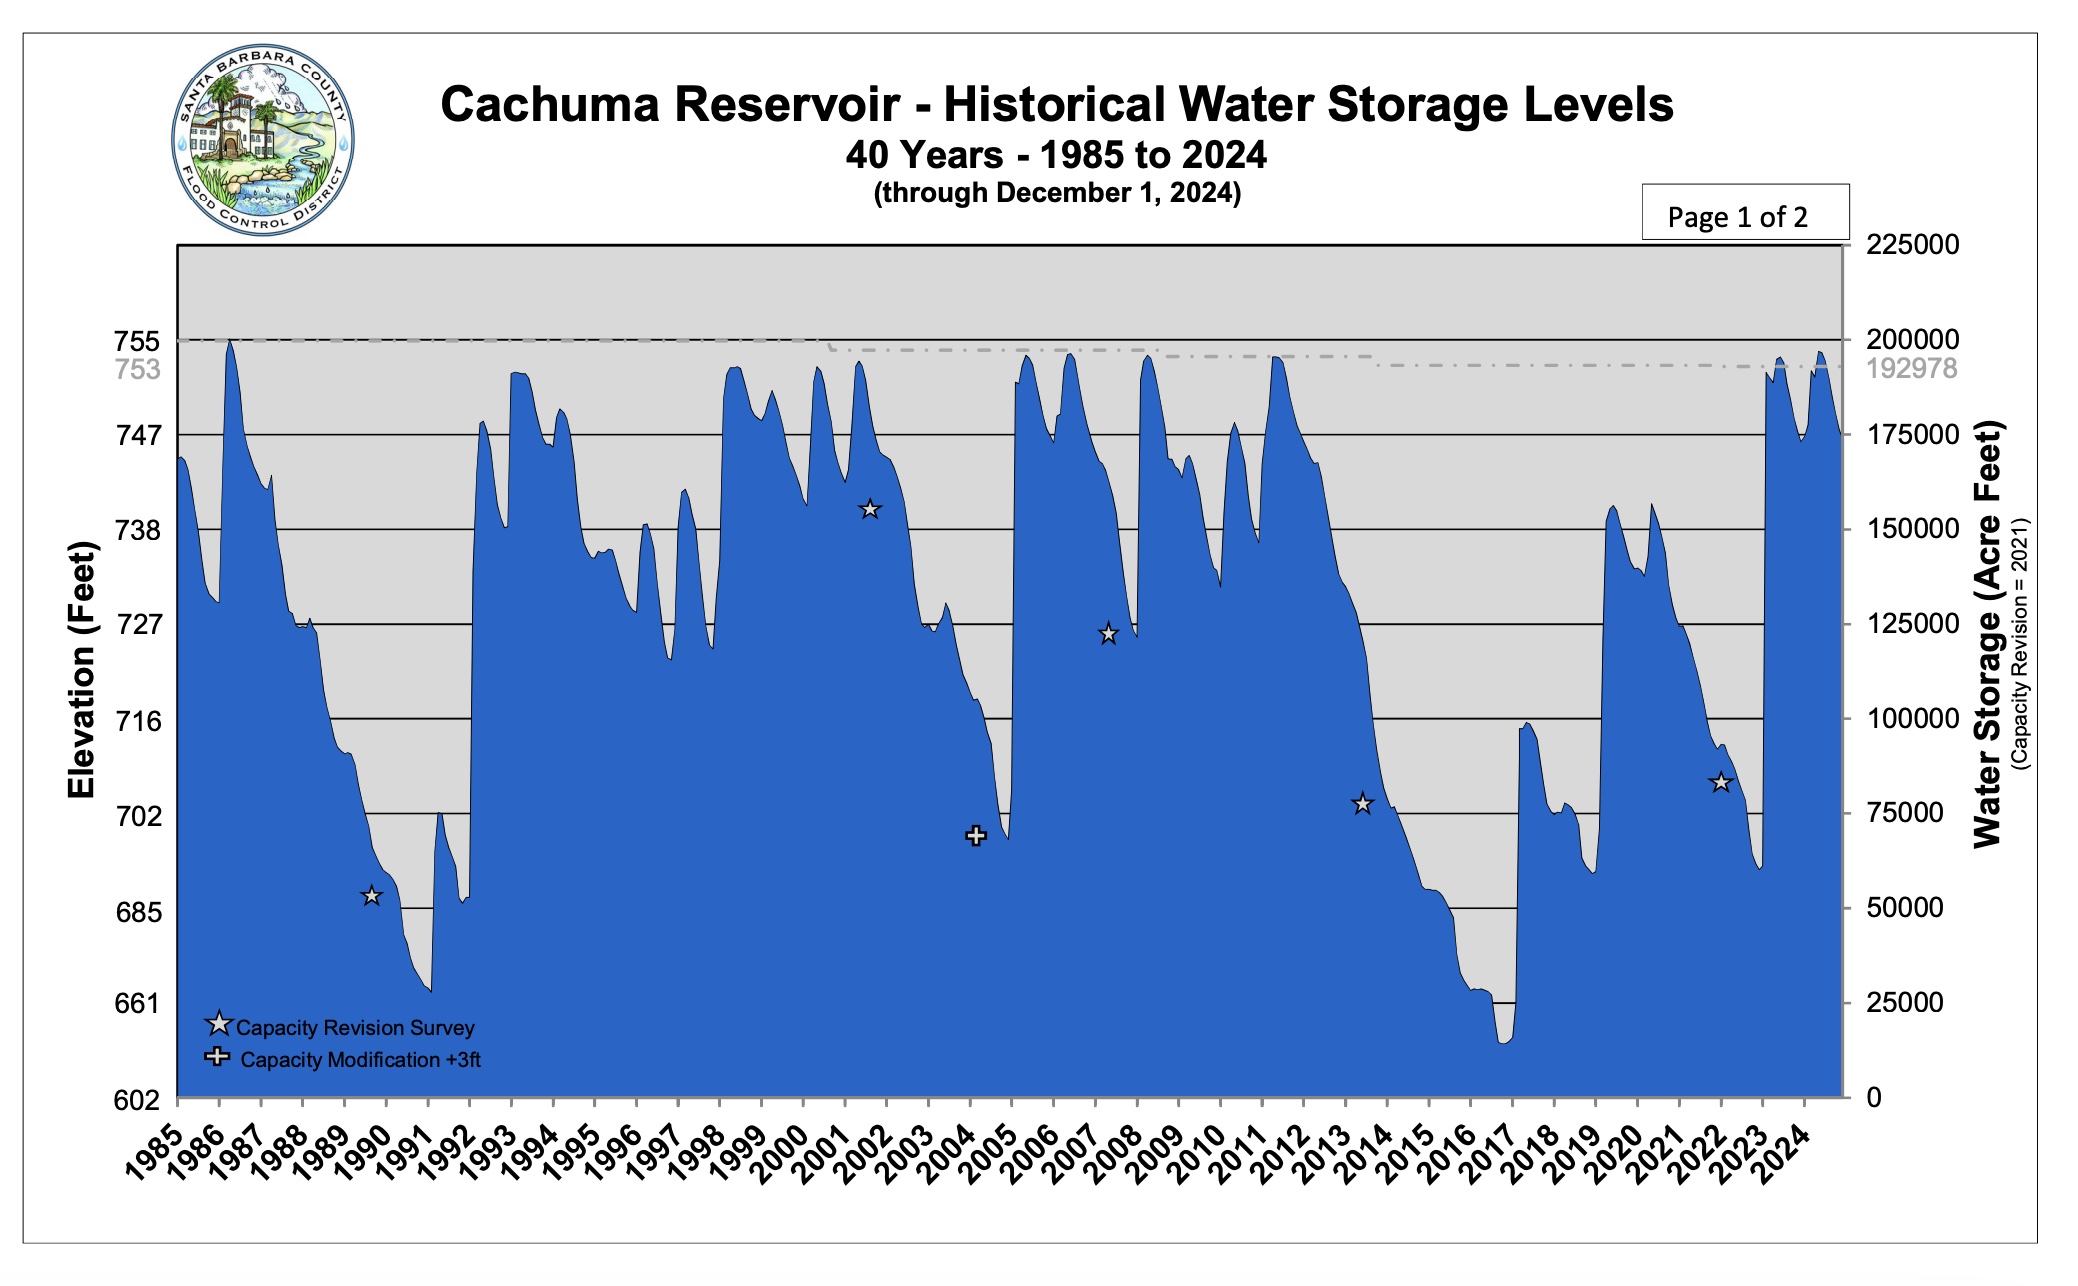
Lake Cachuma was once a primary water source for Santa Barbara County, but the California drought has made it an unreliable resevoir. In 2017, the reservoir was part of the 2.13% of California that was considered to be in an “exceptional drought”. Given that this resevoir is the majority water source for over 200,000 Santa Barbara residents, the water levels in the Cachuma have a major impact on its residents. While the drought is not over, heavy rains in 2022 - 2023 helped Lake Cachuma reach it’s capacity for the first time in 11 years.
In this discussion section you will practice creating animated visualizations to show temporal change in geospatial data. You’ll work with time series satellite imagery to visualize water level fluctuations at Lake Cachuma during California’s recent drought and recovery periods. The goal is to learn how to:
- access and process time series satellite data from the Microsoft Planetary Computer
- work with NAIP aerial imagery data
- combine individual frames into an animated GIF
- communicate temporal environmental change effectively through animation
About the data
NAIP (National Agriculture Imagery Program) provides high-resolution aerial imagery across the continental United States. The imagery is collected during the agricultural growing season and is available approximately every 2-3 years. NAIP provides 4-band imagery (Red, Green, Blue, and Near-Infrared) at 0.6-1 meter spatial resolution, offering detailed views of land surface changes.
We’ll access NAIP data through Microsoft Planetary Computer, a platform that provides free access to large geospatial datasets through a STAC (SpatioTemporal Asset Catalog) API. This allows us to efficiently search for and retrieve imagery over our area of interest across multiple years.
Purpose
We will use satelite imagery to see if we can notice changes in water levels when the reservoir was at an all time low versus the following years. We will be specifically looking at the water levels in Harvey Bay. In order to show the water level change in this 6 year time span, we will create a gif.

General Directions
All material for this activity is located in the section10-gif-STUDENTS.ipynb file in this google drive. Download the notebook to your eds220-2025-sections directory and follow the prompts in the notebook to complete the activity.